Texas electricity rates can vary widely by city, season, and plan type, making it hard to know if you’re getting a fair deal. With more than 140 providers and over 1,500 plans available, understanding Texas electricity rates and how they’re set is the first step toward lowering your bill. As a lifelong Texan, I’ve seen how the wrong plan can add hundreds of dollars in unnecessary costs each year.
This guide explains how Texas electricity rates work, how to compare rates by plan and ZIP code, and what to watch for when shopping for power in deregulated parts of the state.
Whether you’re looking for residential electricity rates in Texas or a better commercial rate for your business, you’ll learn how to read the fine print, time your contract, and choose a plan that actually matches your usage.
- Texas Electricity Rates: The Texas Market
- How Much Texans Can Overpay in a Single ZIP Code
- Know Your Consumption
- What Actually Affects Your Texas Electricity Bill
- Texas Electricity Prices Over the Past 20 Years (PUC Data)
- Rate Trends Over Time
- Current Market Conditions
- Seasonal Electricity Rate Patterns in Texas
- Looking Ahead: The Forecast for 2025-2030
- Differences Between Major Texas Cities
- Texas vs. The Rest of America
- Texas Electricity Rates Compared to Other States
- Essential Tools for Smart Shopping
- Taking Control of Your Energy Costs
- Electricity Cost Calculator for Texas
- Electricity Cost Calculator
- Texas Electricity Rates FAQ
Texas Electricity Rates: The Texas Market
Texas operates a deregulated power market in most areas, which means you have plenty of choices. But with great choice comes the need for smart comparison. Let’s break down what you need to know.
Electricity Rates Checker
⚡ Check Texas Energy Rates

Fixed-Rate Plans: Stability in Uncertain Times
A fixed-rate plan locks in a set price per kilowatt-hour (kWh) that won’t budge for the length of your contract. This is my personal go-to, and here’s why: predictability. Even when energy market prices swing wildly, your rate stays steady. Your monthly bill can still fluctuate based on usage, but the per-unit rate remains constant.
Most Texans, especially those on a budget or seniors on fixed incomes, appreciate this stability. After watching neighbors get hit with shocking bills during market volatility, I always recommend sticking with fixed rates and avoiding gimmicks.
The Risks of Variable and Market-Based Plans
Variable-rate plans can change price month-to-month, or even daily for indexed plans. They might tempt you with a low introductory rate, but when demand or fuel prices spike, so can your bill.
We all remember Winter Storm Uri in 2021. That brutal cold snap left millions without power, and some folks with market-based plans faced devastating bills. One neighbor reportedly received an electric bill for $16,700 during the crisis.
Unless you’re highly savvy and willing to monitor the market closely, it’s safer to avoid plans with time-of-use pricing, usage credits, or other complex structures that can lead to unpredictable costs.
Choosing the Right Contract Length
Plans typically come in 6-, 12-, 24-, or 36-month terms. In volatile times, many Texans prefer longer-term contracts to weather price spikes. Conversely, if prices are expected to drop, a shorter term gives you flexibility to switch sooner.
As of now, longer contracts (two to three years) often offer the best value per kWh, though that can change if the market shifts. Here’s a local tip: timing matters. Electricity rates tend to be lowest in spring and fall when demand drops, making these seasons ideal for signing new contracts.
Matching Plans to Your Usage Profile
Every household is different, and your electricity plan should reflect your lifestyle.
Low-usage households (seniors, small apartments, couples) should look for plans with low base charges and reasonable rates at lower usage levels. Some plans actually penalize very low usage with fees; watch out for those.
High-usage households (large families, large homes) should focus on low energy rates for high consumption and may be willing to accept a higher base fee. Industrial users follow similar logic but on an even larger scale.
Many providers tailor plans to specific needs: free nights for those who can shift usage to evenings, or bill-credit plans that offer bonuses above certain kWh thresholds. My advice? Always compare the Electricity Facts Label (EFL) for each plan. It’s like reading nutrition facts, not fun, but essential to avoid surprises.
Residential vs. Commercial Rates
If you run a business, here’s good news: commercial electricity rates in Texas typically run lower per kWh than residential rates. Businesses often pay around 7-9¢/kWh for energy (before delivery charges), roughly half the residential rate. Industrial users usually get even better deals, averaging around 6-7¢, though they work with highly specialized contracts.
Whether you’re a homeowner, apartment renter, or business owner, shop around. There’s a plan out there that fits your profile; it just takes some comparison.
How Much Texans Can Overpay in a Single ZIP Code
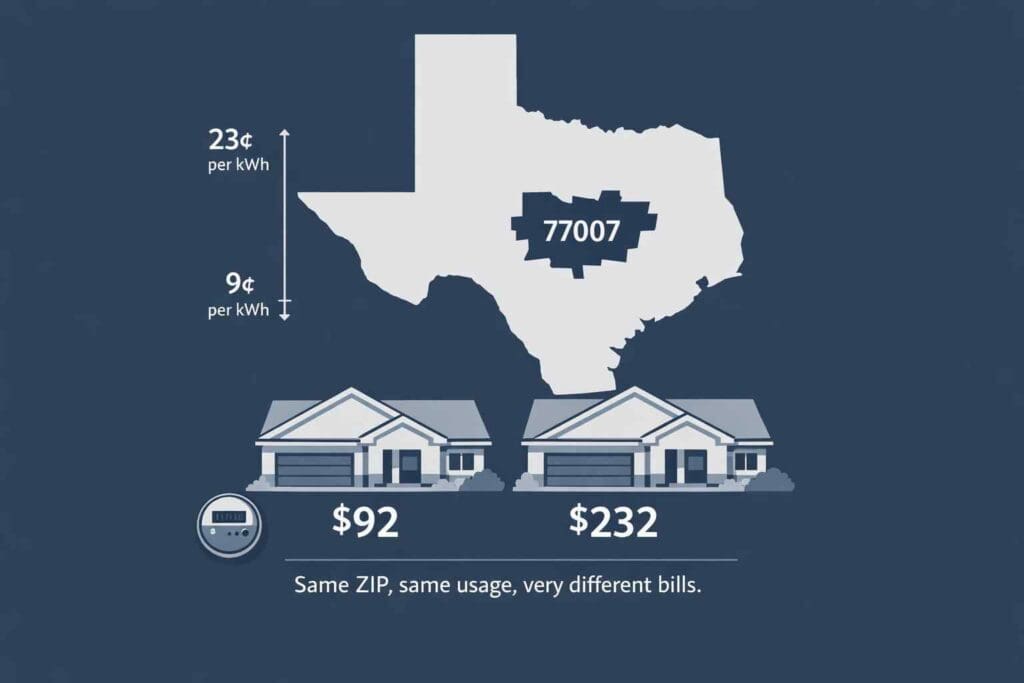
One of the easiest ways to see how Texans end up overpaying for electricity is to look at pricing inside a single ZIP code, where grid conditions and delivery charges are identical.
Using ZIP code 77007 in the Houston area as an example, plan listings available in January 2026 show a wide spread in effective electricity rates when calculated at a common usage level of 1,000 kWh per month.
| Category | Effective Rate | Estimated Monthly Bill |
|---|---|---|
| Lowest available plans | ~9.1–9.5¢/kWh | ~$91–$95 |
| Mid-range common plans | ~14.7–16.5¢/kWh | ~$147–$165 |
| Higher-priced plans | ~18.0–19.9¢/kWh | ~$180–$199 |
| Most expensive plans listed | ~23.3–23.6¢/kWh | ~$233–$236 |
At the low end, several plans priced electricity in the 9¢ per kWh range, translating to a monthly bill just under $100. In the middle of the market, many commonly selected plans fell between the mid-14¢ and mid-16¢ range, resulting in monthly bills closer to $150-$165.
At the higher end, some plans exceeded 18¢ per kWh, pushing monthly costs toward $180 or more. The most expensive options listed in the same ZIP code reached over 23¢ per kWh, producing bills above $230 per month.
All of these plans were available to households in the same ZIP code, using the same utility infrastructure, and consuming the same amount of electricity.
What That Price Gap Means in Real Dollars
For a household using around 1,000 kWh per month, the difference between a lower-priced plan and a higher-priced one can easily exceed $140 per month, or more than $1,600 per year. That difference is not due to higher usage or grid changes. It comes entirely from how the plan is priced.
This is why many Texans feel their electricity bills are high even when their usage seems reasonable. The rate they are on matters far more than most people realize, and small differences in cents per kWh add up quickly over time.
Why People End up Paying More than They Expect
This kind of price spread exists because electricity plans in Texas are structured in very different ways. Some plans advertise low headline rates that only apply at specific usage levels. Others include base charges, bill credits, or time-based pricing that raise the effective rate once real-world usage is applied.
Another common factor is timing. Customers who stay on the same plan after a contract ends often default to higher-priced options, even though lower-cost plans remain available in their area.
In a market with dozens of plans in a single ZIP code, the challenge is not access to choice. It is understanding which options actually result in lower bills.
Why Zip-Level Comparisons Matter
Statewide averages and advertised rates only tell part of the story. What matters most is how plans perform at a specific usage level, in a specific ZIP code, under real delivery charges.
Looking at pricing this way helps explain why two neighbors with similar homes can see very different bills, and why comparing electricity plans by ZIP code and expected usage is one of the most effective ways to avoid overpaying in Texas.

Know Your Consumption
The average Texas household uses about 1,140 kWh per month. (Everything’s bigger in Texas, including our air conditioning bills!) If you’re unsure of your usage, review your bills from the past 12 months or use an electricity usage calculator.
Knowing your typical consumption helps you compare plans accurately. After all, the best plan for a high-usage home looks very different from the best plan for a frugal apartment dweller.
Use the Texas View consumption calculator at the end of this article.
What Actually Affects Your Texas Electricity Bill
Most Texans focus on the advertised rate, but that number alone does not determine the final bill. Your monthly total is shaped by several separate components, some of which stay the same no matter which provider you choose.
The main factors that determine your bill
| Factor | What it means | Why it matters |
|---|---|---|
| Electricity usage (kWh) | How much power your home uses during the month | This is usually the biggest driver of your bill, especially in summer |
| Energy rate (¢/kWh) | The price you pay per unit of electricity | Lower rates help, but only when paired with realistic usage |
| Base charges | Flat monthly fees charged by the provider | These can raise bills for apartments and low-usage homes |
| Delivery fees | Charges from the local utility (TDSP) | These are fixed and apply no matter which provider you choose |
| Seasonal demand | Higher usage during heat waves or cold snaps | Summer demand often pushes bills higher even on fixed-rate plans |
| Plan structure | Fixed, variable, time-of-use, or tiered plans | Some plans reward certain usage patterns while penalizing others |
Why a “low rate” can still lead to a high bill
Two homes on the same plan can see very different bills. A low advertised rate may apply only within a narrow usage range or exclude base charges and delivery fees. Homes that use less electricity, such as apartments or energy-efficient houses, often feel these extra costs more strongly because fixed fees make up a larger share of the total bill.
A simple example
- Home A uses 500 kWh in a mild month
- Home B uses 2,000 kWh during a Texas summer
Even if both homes are on the same plan, Home B’s bill will rise much faster because usage increases stack on top of delivery fees and summer demand charges.
Why summer bills spike in Texas
Texas homes rely heavily on air conditioning. When temperatures stay high overnight, usage remains elevated around the clock. This combination of high demand and sustained usage is why bills often jump in July and August, even when rates appear unchanged.
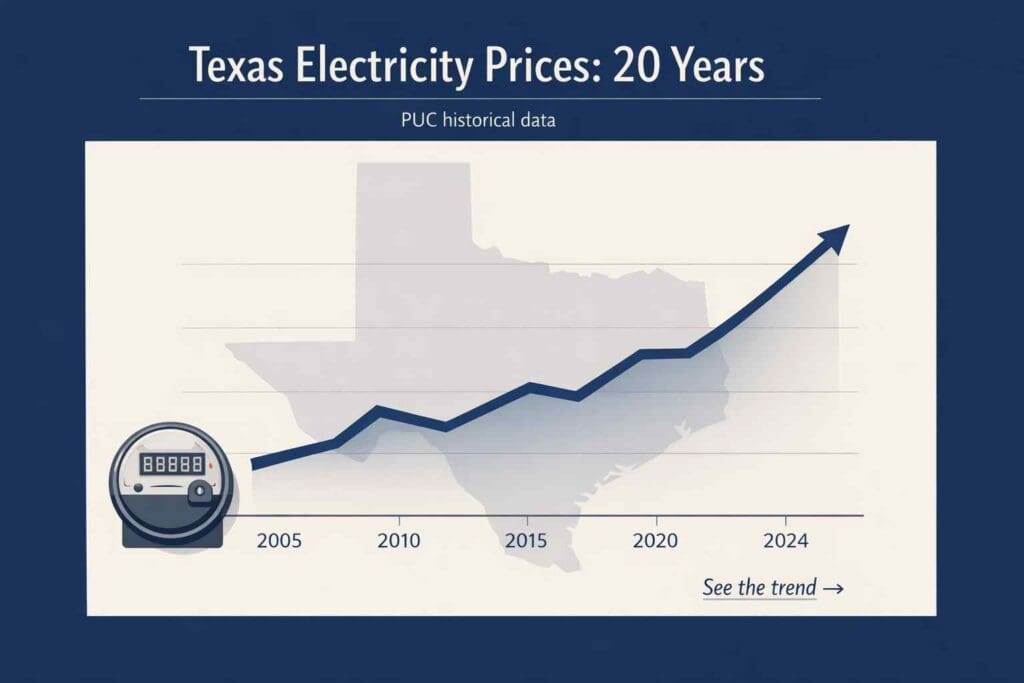
Texas Electricity Prices Over the Past 20 Years (PUC Data)
Looking at electricity prices over time helps explain why many Texans feel squeezed today. While rates have fluctuated, the overall baseline has risen, especially since 2021.
Using official Public Utility Commission of Texas retail rate comparison tables, we can see how typical residential pricing has changed across five reference points over roughly two decades. These figures reflect all-in average rates calculated from Electricity Facts Labels and include both energy and delivery charges, based on standard usage levels.
What the historical data shows
| Year (PUC snapshot) | Typical residential rate range (¢/kWh) | Market context |
|---|---|---|
| 2005 | ~9¢ to ~13¢ | Pre-pandemic lows, high competition, and low natural gas prices |
| 2010 | ~8¢ to ~12¢ | Post-recession stability, strong price competition |
| 2015 | ~8¢ to ~11¢ | One of the lowest sustained pricing periods |
| 2020 | ~8¢ to ~11¢ | Pre-pandemic lows, high competition, low natural gas prices |
| 2024 | ~16¢ to ~20¢+ | Post-2021 reset, higher fuel, grid, and capacity costs |
Source: Public Utility Commission of Texas retail electric service rate comparisons, June 2005, June 2010, June 2015, June 2020, and June 2024
Why today’s rates feel different
What stands out in the data is not just that rates increased, but how much the floor moved.
From roughly 2005 through 2020, many Texans could routinely find plans in the high-8¢ to low-10¢ range at common usage levels. By contrast, the lowest widely available plans in 2024 were often above 16¢ per kWh, with many plans approaching 18–20¢ per kWh, even before extreme usage.
That means:
- A rate that once would have been considered expensive is now closer to average
- Shoppers have less room for error when choosing plans
- Overpaying by a few cents per kWh has a much larger dollar impact than it did a decade ago
The key shift after 2021
The data shows a clear structural break after 2021. Prices did not simply spike and return to prior norms. Instead, they reset at a higher level.
Several long-term factors contributed to this shift:
- Higher and more volatile natural gas prices
- Increased grid reliability and capacity costs
- Growing statewide demand from population growth and energy-intensive industries
- Fewer ultra-low plans compared to earlier years
As a result, while prices still fluctuate seasonally, they are doing so around a much higher baseline than in the 2010s.
Why this matters for Texans today
Understanding this 20-year context helps explain two things many Texans experience:
- Why electricity feels expensive even when rates stabilize
- Why choosing the wrong plan today costs more than it used to
When rates were 9¢ to 10¢, overpaying by a cent or two was annoying. At 17¢ to 19¢, the same mistake can add hundreds of dollars per year to a household’s bill.
This is why plan structure, usage alignment, and timing matter far more now than they did a decade ago.
Rate Trends Over Time
The Steady Years (2014-2020)
For most of the last decade, Texas electricity rates held remarkably steady, hovering around 11–12¢ per kWh. In 2014, the average residential rate was 11.8¢, and it actually dipped to around 11¢ by 2016. Through 2020, we stayed near 12¢ while the U.S. average sat slightly higher at 12–13¢.
We Texans enjoyed cheaper power than the national average, thanks mainly to abundant natural gas and expanding wind energy, which keep costs down. Many of us locked in long-term fixed plans during those golden years.
Texas Average Residential Electricity Rates (2014–2025)
| Year | Average Rate (¢/kWh) | Primary Market Driver |
|---|---|---|
| 2014 | 11.6 | Stable fuel prices, low demand growth |
| 2015 | 11.3 | Falling natural gas prices |
| 2016 | 11.1 | Continued low fuel costs |
| 2017 | 11.2 | Normal demand, balanced supply |
| 2018 | 11.0 | Oversupply, mild summer demand |
| 2019 | 11.2 | Slight demand growth, stable fuel |
| 2020 | 11.4 | Higher residential usage |
| 2021 | 12.8 | Fuel cost increases, grid stress |
| 2022 | 15.5 | Fuel shock, extreme weather events |
| 2023 | 14.3 | Partial pullback, lower volatility |
| 2024 | 14.9 | Higher baseline, strong summer demand |
| 2025 | 15.4 | Load growth, tighter grid margins |
The Sharp Climb (2021-Present)
Everything changed around 2021–2022. Texas rates shot up, reaching roughly 14–15¢ by 2023–2024, even as the U.S. average rose to about 16–16.5¢. This spike represents the most significant sustained increase in recent memory, narrowing the gap between Texas and the rest of the country.
Between 2014 and 2024, Texas electricity prices increased by over 37%, a massive shift after years of relative calm. Several factors drove this surge:
- Post-pandemic fuel price increases: Natural gas prices jumped significantly in late 2021 as the economy recovered
- Winter Storm Uri fallout: The February 2021 crisis nearly collapsed our grid, with wholesale prices hitting $9,000/MWh. While most fixed-rate customers were shielded from immediate spikes, the crisis caused provider bankruptcies and long-term market caution.
- Sustained high demand: Texas population growth and new energy-intensive industries continue to strain the grid
Where We Stand Now
By the end of 2025, average Texas electricity rates were holding in the mid-15¢ range, a modest increase from where things stood in 2024. The rapid spikes seen earlier in the decade have largely eased, and prices have moved into a narrower band instead of swinging sharply month to month.
Natural gas costs remained more stable than in 2022, which helped prevent another round of major jumps, though summer demand still pushed rates higher at times. Even with that relative stability, electricity prices remain well above pre-2021 levels, and current market conditions suggest a return to those older lows is unlikely in the near future.
Current Market Conditions
Finding the Lowest Rates
While averages tell one story, savvy shoppers can still find deals. Historically, some plans in the late 2010s offered 8–9¢. Even today, short-term promotional plans occasionally hit 8–9¢ per kWh in certain areas. Recently, some Dallas 6-month plans advertised 8.4¢, while Houston 12-month fixed plans came in around 9.5¢.
These are outliers and often come with conditions or limited availability, but they show that the lowest rates typically run a few cents below the average. Just remember: if something looks too cheap, read the fine print. Ultra-low rates often require adherence to specific usage windows or use time-of-use pricing.
According to the U.S. Energy Information Administration, Texas residential electricity prices averaged about 15.8¢ per kWh in late 2025, slightly below the national average of about 18.1¢ per kWh.
Seasonal Fluctuations
We see rates rise and fall throughout the year. Prices typically increase in summer and winter, when Texans strain the grid with AC and heating, and then drop in milder spring and fall when demand eases.
Savvy shoppers use this cycle to their advantage; you’ll often find better deals in April/May or October versus August or February. I always try to time my plan renewals for spring or fall.

Seasonal Electricity Rate Patterns in Texas
Electricity rates in Texas do not move evenly throughout the year. Even when annual averages appear stable, seasonal demand can cause noticeable swings in both rates and monthly bills.
Texas electricity usage is heavily influenced by temperature, especially during extended heat waves. As demand rises, prices tend to follow, particularly for customers on variable or short-term plans.
Typical seasonal patterns
| Season | What usually happens | Why it matters |
|---|---|---|
| Winter (Jan–Feb) | Moderate usage, fewer spikes | Heating demand is lower for most homes |
| Spring (Mar–May) | Lower usage, more stable rates | Often the best time to shop for plans |
| Summer (Jun–Sep) | Highest usage, higher volatility | Air conditioning drives demand statewide |
| Fall (Oct–Dec) | Usage tapers, rates stabilize | Bills often drop before winter |
While fixed-rate plans help smooth pricing, total bills still rise in summer because homes consume far more electricity, especially during hot nights when air conditioners run continuously.
Why summer bills feel worse than the data suggests
Annual rate averages can hide short-term pressure. A household may pay the same rate year-round, but a July bill using twice as much electricity as April will still be significantly higher. This effect is amplified in larger homes, older buildings, and properties with inefficient cooling systems.
Texas also sees sustained demand during summer evenings, when temperatures remain high after sunset. That extended load keeps usage elevated for longer periods compared to many other states.
Looking Ahead: The Forecast for 2025-2030
Short-Term Outlook (2025-2026)
Industry experts don’t expect prices to drop significantly in the near future. We’re experiencing what feels like a plateau: we’re no longer climbing as fast, but we’re on high ground.
Recent forecasts indicate that 2025 and 2026 will be similar in price, with residential plans averaging in the mid-teens (¢/kWh). One estimate calls for a modest 3–5% increase from 2025 to 2026, which is less than 1¢ spread over a year, relatively small in the grand scheme.
Long-Term Projections (Through 2030)
Looking further ahead, the outlook shows continued upward pressure. The Texas Energy Poverty Research Institute (TEPRI) forecasts a roughly 29% increase in residential rates from 2025 to 2030, potentially raising a 15¢ rate to around 19–20¢ within five years.
What’s driving this projection?
Grid Infrastructure Investments: The Public Utility Commission of Texas (PUCT) has approved approximately $32 billion in new transmission and distribution projects through 2032. Building and upgrading power lines, transformers, and other infrastructure is expensive, and those costs get passed to consumers.
We’re all chipping in to beef up the grid, which should improve reliability and support our growing state.
Soaring Demand: Texas power demand has jumped about 30% since 2020. We’re not just growing in population, we’re attracting energy-intensive industries. New data centers for cloud computing and AI, cryptocurrency mining operations, and hydrogen production facilities are consuming massive amounts of electricity.
This surging demand, especially during peak times, can drive prices up unless supply grows accordingly.
The Renewable Energy Balance: Texas continues to add renewable capacity, with wind and solar now contributing nearly 40% of our power generation. Cheap wind and solar help keep wholesale prices lower most of the time. However, when the sun isn’t shining and the wind isn’t blowing, typically on very hot summer evenings, we rely on natural gas “peaker” plants, and that power isn’t cheap.
What This Means for You
Essentially, plan for today’s prices and a bit more. If you find a reasonable fixed-rate deal now, it might pay to grab it, especially if it carries you through the next couple of summers.
Experts consistently recommend: (1) use energy efficiently to reduce usage where possible, and (2) lock in a low fixed rate when market dips allow. The only part of the electric bill you can truly shop and control is the energy rate; delivery charges and taxes are fixed costs you can’t escape.
Based on the forecast, I’d personally lean toward longer-term plans signed during spring/fall rate dips to ride out future increases. Prepare for slightly higher prices each year rather than expecting a significant drop.

Differences Between Major Texas Cities
Electricity rates across Texas are shaped less by city names and more by local grid territory, housing patterns, and sustained demand. While all deregulated areas operate under the same market rules, real-world pricing still clusters by region.
| Metro area | What stands out | Why rates tend to land there |
|---|---|---|
| Houston area | Wide plan selection, competitive pricing | Dense population, high competition among providers, heavy but predictable summer usage |
| Dallas–Fort Worth | Slightly higher average bills | Rapid population growth, large single-family homes, strong summer and winter demand |
| Austin area | Fewer ultra-low teaser rates | Tighter grid margins, higher baseline usage, less aggressive discount pricing |
| San Antonio area | More stable pricing | Slower growth, steadier demand profile, fewer extreme usage spikes |
| Smaller deregulated cities | Inconsistent pricing | Fewer providers, less competition, higher impact from delivery fees |
This does not mean one city always has cheaper power than another. It means the pricing behavior is different, even before plan choice enters the picture.
Why the utility territory matters more than the city
Texas electricity pricing is tied to Transmission and Distribution Utilities (TDSPs), not city governments. Two homes ten miles apart can see different pricing simply because they fall under different delivery zones.
That affects:
- Delivery fees that appear on every bill
- Which providers compete in that area
- How aggressively rates are discounted
This is why electricity tools and providers always ask for a ZIP code first. City-level averages miss these differences.
What this means in practice
A Houston apartment using 700 kWh may pay less than a Dallas home using 1,800 kWh, even if the advertised rate looks similar. In fast-growing metros, usage patterns and fixed charges often matter more than the rate headline.
For most Texans, the most accurate way to understand pricing is to compare plans by ZIP code and expected usage, not by city reputation.

Texas vs. The Rest of America
How We Stack Up Nationally
Texas electricity rates remain below the national average, though the gap has narrowed. As of early 2025, the average residential rate in Texas was around 14.7¢/kWh, about 8–10% lower than the U.S. average of ~15.9¢. Your friends and family in many other states, especially on the East Coast or in California, likely pay higher electricity rates.
Texas Electricity Rates Compared to Other States
Texas electricity rates often get attention because the state operates differently from most of the country. While prices fluctuate, Texas typically remains below the national average, even when rates feel high locally.
As of late 2025, average residential electricity prices in Texas were in the mid-15¢ per kWh range, while the U.S. average was closer to the high-17¢ to low-18¢ range. That gap exists largely because Texas uses a competitive, deregulated electricity market, rather than a single regulated utility system.
Why Texas is different
Most states set electricity prices through regulated utilities, which adjust rates slowly over time. Texas, by contrast, allows retail electricity providers to compete for customers. This competition can lead to:
- Lower prices during periods of stable fuel costs
- Faster price increases when demand spikes or fuel costs rise
- More plan options, but also more complexity
Texas is also served by its own grid, ERCOT, which operates largely independent of the rest of the country. That isolation affects how supply and demand balance during extreme weather and contributes to seasonal price swings.
How Texas compares in practice
- Compared to high-cost states like California or New York, Texas electricity is generally cheaper on average.
- Compared to regulated states in the Midwest or Southeast, Texas rates can be more volatile year to year.
- Compared to the national average, Texas usually remains slightly lower, even after the post-2021 price increases.
What this means for Texans
Lower average prices do not always mean lower bills. Texas homes often use more electricity than homes in other states, mainly due to air conditioning needs. As a result, total monthly bills can still be high even when the per-kWh rate looks competitive.
The key difference in Texas is flexibility. Residents have more control over when and how they shop for electricity, but that also means timing and plan choice matter more than in regulated states.
The Extremes
Texas isn’t the absolute cheapest state for electricity. Oklahoma and Louisiana, with extensive local generation and regulated utilities, often have rates in the 9–12¢ range. On the flip side, some states cost way more:
- California: Residential rates average around 25–30¢ (about 27¢ as of 2024), nearly double Texas rates
- Northeast states: New York, Massachusetts, and others often exceed 20¢
Texas sits in the lower-middle range nationally, not rock-bottom, but certainly more affordable than many populous states.
Business Advantage
Texas commercial and industrial electricity rates are exceptionally competitive nationally. Our businesses generally pay far less per kWh than businesses elsewhere, which attracts industry. Texas commercial rates average around 9¢, while the U.S. commercial average sits at ~14¢. That’s a significant cost advantage.
Important Caveat
Not all Texans can choose their provider. About 15–20% of the state, those served by municipal utilities like Austin Energy or rural co-op utilities, live in regulated zones with set tariffs. Their rates differ and aren’t subject to market shopping.
But for the vast majority of us in Houston, Dallas, Fort Worth, and hundreds of other communities, we benefit from Texas’s competitive arena and generally lower-than-average prices.

Essential Tools for Smart Shopping
Knowledge is power. Here are tools that can make finding the right plan easier:
Electricity Usage Calculator
Not sure how much electricity you use? Provide details such as your home’s square footage, number of residents, and appliance usage. The tool estimates your monthly and annual kWh consumption, plus approximate costs. Perfect for new renters with no past bills or anyone looking to budget. Check
Historical Rate Lookup
Enter your ZIP code to see historical electricity rate data for your area. View trends showing average, lowest, and highest rates over recent months or years. This helps set expectations. If current rates are near a 2-year low, it might be time to lock in. If they’re at a peak, consider a shorter term.
Time-of-Year Price Trend Estimator
This tool visualizes seasonal price trends for your region. It might show that spring rates averaged 20% lower than summer rates over the past 5 years, helping you decide when to start a new contract. Think of it as a farmer’s almanac for electricity prices.
Rate Comparison by Usage Profile
Choose a usage profile (single in a small apartment, family in a large home, small business) or input a custom profile. The tool compares which plans would actually be cheapest for your scenario, accounting for tiered rates and bill credits. Sometimes a plan advertised at 2000 kWh is actually more expensive at 500 kWh due to base fees.
Texas View Comparison Widget
The all-in-one shopping tool: enter your ZIP code and estimated monthly usage to pull up real-time offers from dozens of providers. Filter by fixed vs. variable, contract length, green energy content, and more. Sort by price to find your best option. It’s designed to be more user-friendly than the state’s official Power To Choose site while still pulling official data.
⚡ Check Texas Energy Rates
Enter your ZIP code to see lowest electricity rates in Texas
 (5)")
Taking Control of Your Energy Costs
Texas electricity might seem complicated, but with local know-how and the right tools, you can wrangle those rates and come out ahead. Remember these key takeaways:
- Lock in fixed rates during spring or fall when prices typically dip
- Know your usage to compare plans accurately
- Read the fine print on ultra-low promotional rates
- Plan for gradual increases rather than expecting price drops
- Use available tools to research, compare, and make informed decisions
The era of ultra-cheap power may be behind us, but Texas still offers competitive rates and plenty of choices. Stay informed, shop smart, and may your next electric bill be a pleasant surprise!
All rate figures are current as of the end of 2025 and will be updated as new data becomes available. Always check the latest statistics and consult official resources when making your electricity decisions. Sources include data from the U.S. Energy Information Administration (EIA), Electric Reliability Council of Texas (ERCOT), Texas PUC filings, and Texas View research.
Electricity Cost Calculator for Texas
Electricity Cost Calculator
Simple estimate first. Advanced fees if you want it closer to a real bill.
Texas Electricity Rates FAQ
Is electricity cheaper in Texas than in other states?
Yes. Texas residential electricity averages about 15.5¢/kWh, about 5–10% lower than the national average. Thanks to deregulation and low natural gas prices, we generally pay less than states like California or New York.
Which Texas city has the lowest electricity rates?
Houston typically has the cheapest rates due to fierce provider competition. Dallas is slightly higher, and Austin is often the most expensive among major cities because of its city-owned utility.
Why are electricity bills higher in the summer?
Air conditioning. In Texas heat, your AC can make up 60–70% of your bill. Summer usage spikes often lead to 40–60% higher bills than in spring or fall.
What’s the average monthly electric bill in Texas?
About $230 for a typical home, but that varies. A 1-bedroom apartment might pay $90–$110, while a 4-bedroom home could be $200–$270 during peak months.
Why do rates vary by ZIP code?
Each region has a different TDU (like Oncor or CenterPoint) with its own delivery fees. Some areas also have more retail competition, which lowers prices.
Does Texas use renewable energy?
Yes. Texas leads the U.S. in wind power and is rapidly expanding solar capacity. On windy or sunny days, this can lower wholesale prices and help stabilize your rate.
Why are rural electric bills sometimes higher?
Fewer homes per mile of power line means higher delivery costs. Also, co-ops and municipal utilities may face less price competition than in deregulated areas.

Christian Linden is a seasoned writer and contributor at Texas View, local Texas resident, travel enthusiast.and author of the Home Energy Playbook. He specializes in topics that resonate with the Texan community. With over a decade of experience in journalism, Christian brings a wealth of knowledge in local politics, culture, and lifestyle. When he's not writing, Christian enjoys spending weekends traveling across Texas with his family, exploring everything from bustling cities to serene landscapes.